Would You Like to Start Over? What It Is, What It Means
Time Warner’s Start Over service is generating some interesting results, some of which challenge the conventional VOD wisdom. Simply stated, Start Over is a success and predictably so. The launch of the Start Over service was born of direct customer feedback through Time Warner Cable’s market research. When subscribers were asked to rank a comprehensive list of interactive TV applications, the Start Over service was by far the most popular. In fact, it was 10 times more popular than the next most popular service. When you provide a service that your customers have asked for that clearly, its success is predictable—provided you can deliver. Fortunately, Time Warner Cable has invested in the technology to make it happen. Start Over represents one of the first new services to leverage the analog/digital simulcast and real-time acquisition technologies deployed within the company. Here follows some insight into why the service is so successful, plus analysis of real-world data to learn more about the demands it puts on the video on demand (VOD) infrastructure. What is Start Over? Start Over is one of the first large-scale deployments of a service that enables the time-shifting of live television without the need for upgrades to customer premises equipment (CPE). Time-shifted TV allows digital cable subscribers to begin watching their favorite broadcast TV program at a more convenient time within an expanded time window. Unlike traditional on-demand services that have license windows measured in days or weeks, the Start Over content is only available to start a session within the actual broadcast window of the particular content. Here’s how it works: 
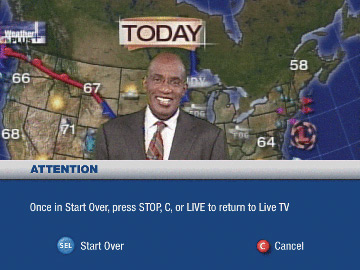 1. Upon channel tuning, a rights-driven “prompt” tells the viewer that the feature is active and available for that program. (See Figures 1 and 2.) 2. After the viewer presses SELECT, the show switches from the live broadcast stream to an on-demand stream from the server. 3. The show starts over at the beginning, with the ability to pause the program, but not fast-forward or rewind. 4. At end of show, the viewer can Start Over the next show or return to live TV. This service represents a collaborative approach between the cable operator and the content providers where the advertising value is preserved. The service is currently offered free to the digital subscribers. As the service is currently offered, the ability to access the content and start it over is directly limited (through software controls) to the broadcast window. That is to say, the customer can only access the on-demand version while the show is being broadcast. The hope is that in the future the Start Over window will be opened up beyond the broadcast window. During the session, the user can Start Over multiple times during the broadcast, pause the program, and Start Over the following show once the session ends. When the service first launched on Nov. 1, 2005, it consisted of approximately 50 channels comprising 10 network groups and two local channels (the local WB and PBS affiliates). TWC is continually working to add additional content providers to the offering. What is the impact? The impact of this service needs to be examined in terms of sessions (streams) and content. Unlike the world of telephony where content (phone calls) did not really factor into the traffic equation, in the world of VOD, content is the key variable in the traffic model equation. Real-time acquisition services such as Start Over are proving to be major drivers of new content, which in turn is driving new sessions. Let’s examine the interrelationship between sessions and content more closely. Historical traffic modeling equations are based on session arrival time and the hold time of that session to determine the total number of simultaneous sessions at a particular blocking probability. With the introduction of Start Over, there is an increase in the number of new sessions and a change of hold times respective to those new sessions, resulting in a greater number of simultaneous sessions. Clearly it is the content Start Over makes available that is driving this trend. Since the introduction of the Start Over service, the VOD system has seen between 50 percent and 75 percent more peak stream usage. (At the service group level, this requires the VOD service group to be split or more channels to be added to the narrowcast to avoid contention.) In Time Warner Cable Start Over deployments, more than 10 percent of digital set-top boxes access the service on a daily basis, employing it on average more than 1.5 times per session. The Start Over icon acts as both a user prompt and an incredibly powerful advertisement for the service. It is seen every time a customer tunes to a Start Over enabled program (albeit for just a few seconds so as not to be overly intrusive). Additionally, we see a strong correlation between session duration and the duration of the broadcast show. In other words, when customers order the program, they watch it. And by the way, they watch the ads, too. A deeper look Seven days of data were collected from one of the first sites in the Time Warner network to implement Start Over. Data was collected by extracting session-based and asset-based data from the production logs on the system. Sessions are identified only by an abstract session ID to protect subscriber privacy. Genre data was also collected from each asset. (See Table 1.) Examples of genres are: RTA, Real Time Asset (Start Over program); HOD, HBO on Demand; MOD, Movies on Demand; and so on. In analyzing the data, we looked at stream utilization (when people watch and how much); content distribution (what they watch, both over time and at any given moment); and modulation and genres (roughly, how the type of content they watch changes over time). As we’ll see, two issues of particular interest became evident when analyzing the data. The first is the phenomenon “long tail.” The long tail does not provide an accurate description of how content is viewed at any given time in an on-demand system. The second issue is content velocity, or the speed with which new content enters and leaves the system. This has implications for content storage, propagation and data capacity and throughput. Stream utilization Figures 3-9 provide an overview of the system during the period measured. The figures each show a 24-hour period beginning and ending at midnight. The Y-axis of each figure represents the total session count on the system, while the X-axis represents time. The colored bands display the breakdown of the content by genre at the beginning of each minute.
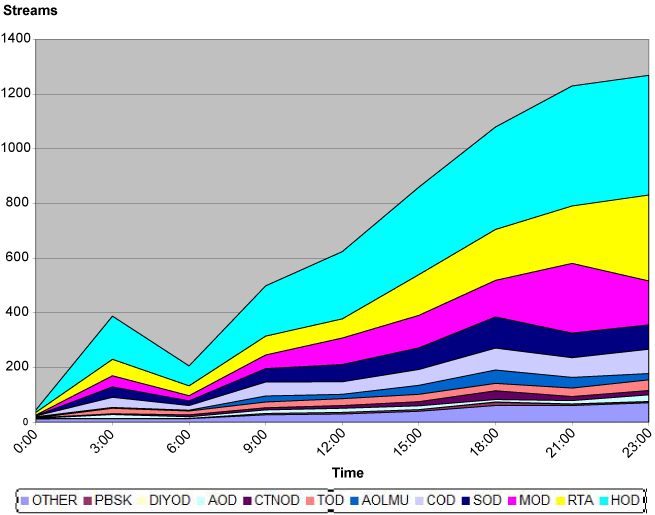
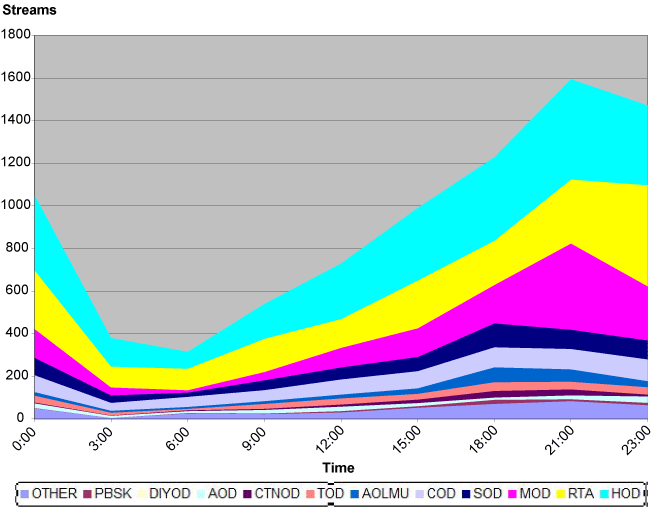
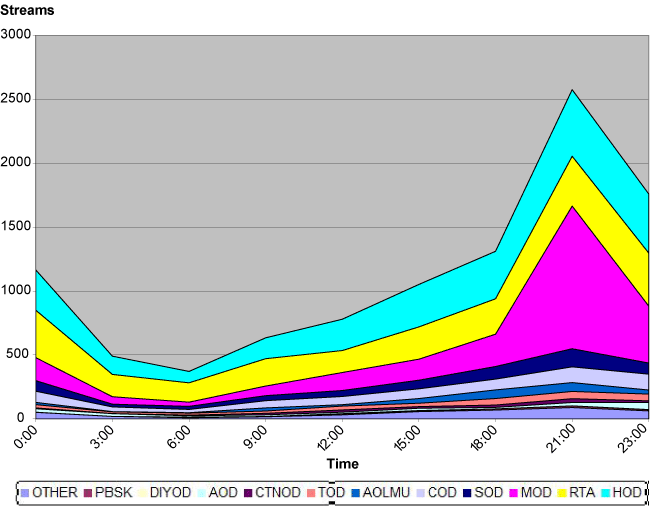
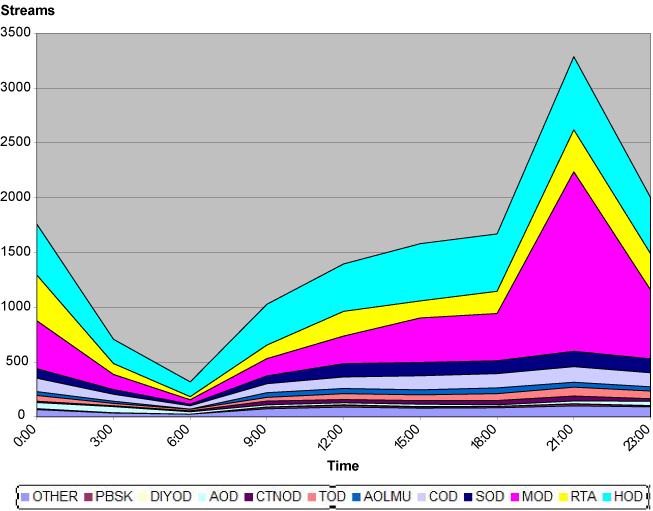
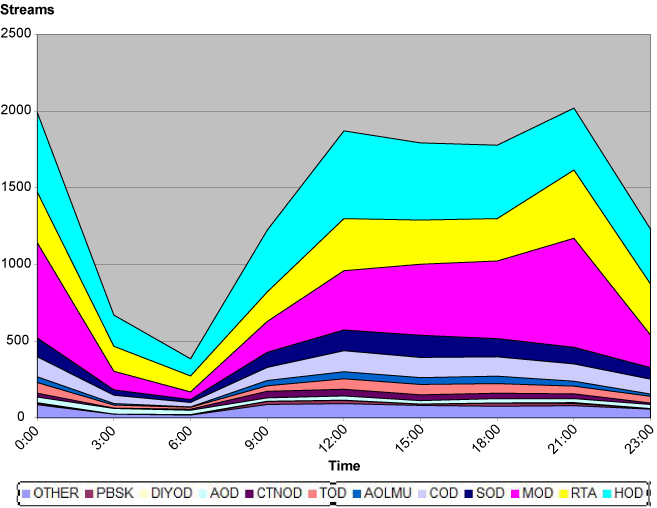
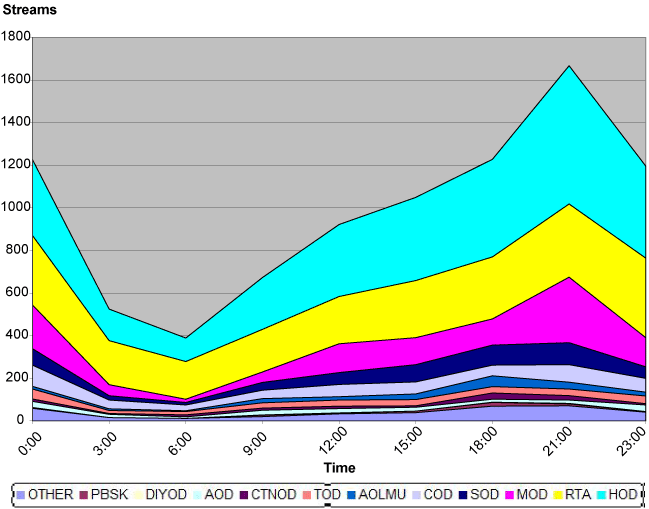
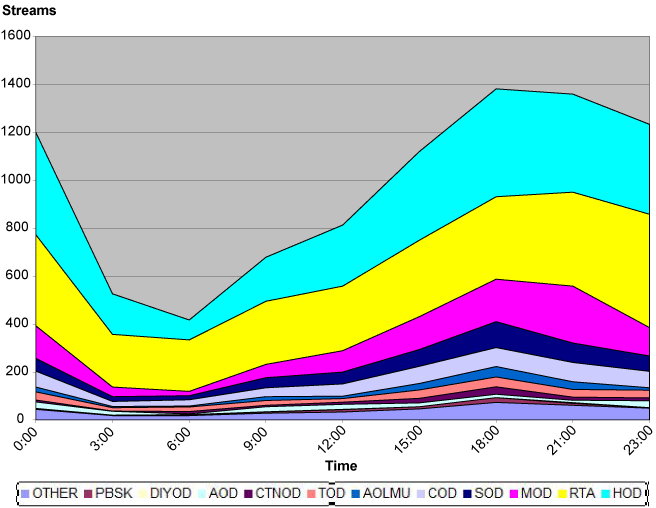 A quick look at these charts reveals some clear observations. First, usage patterns and total utilization vary significantly throughout each day, with movie usage showing the largest fluctuation. Both RTA and music video viewing are significant. Perhaps the most interesting observations are the pure stream count variability and the difference in usage through the day. The data indicate that while the pure peak session count is lower on Sunday than it is on Saturday, the utilization of the system extends well beyond traditional prime time. A second interesting observation is the difference in usage among movies, RTA, and the traditional subscription VOD (SVOD) services of HBO, Showtime, Cinemax and The Movie Channel between the weekend and the weekdays. It appears that subscribers watch more movies on weekend nights and more short content on the weekdays. Also, although there are more than 35 genres defined on the system, actual sessions are consistently dominated by only six genres. Investigation of the data sets within those genres indicates that a very small number of titles represent the majority of the stream. We’ll take a closer look at this idea in the next section. Finally, from a pure utilization perspective, we can observe that the system peaks with approximately 3,500 simultaneous sessions on Saturday night and has lowest observed peak of approximately 1,600 simultaneous sessions. The weekly peak is approximately 120 percent higher than the lowest day’s peak. By comparison, a larger Time Warner system that does not have Start Over enabled saw a weekly peak 50 percent higher than the lowest peak. These observations lead to the following conclusions. First, at a gross level, the usage of the system follows some fairly accepted notions. However, the content makeup of the system is quite turbulent, but at any point in time the content and the stream mix are relatively stable. Also, while there are other variables that must be considered when comparing two systems, the initial data suggest that Start Over may lead to a higher peaks in usage compared to traditional VOD systems. Content utilization This data set analyzes the usage of content both instantaneously and over time. Figure 10 shows the stream counts vs. content over a 24-hour period, and Figure 11 shows stream counts vs. content at the peak utilization time on Saturday night.
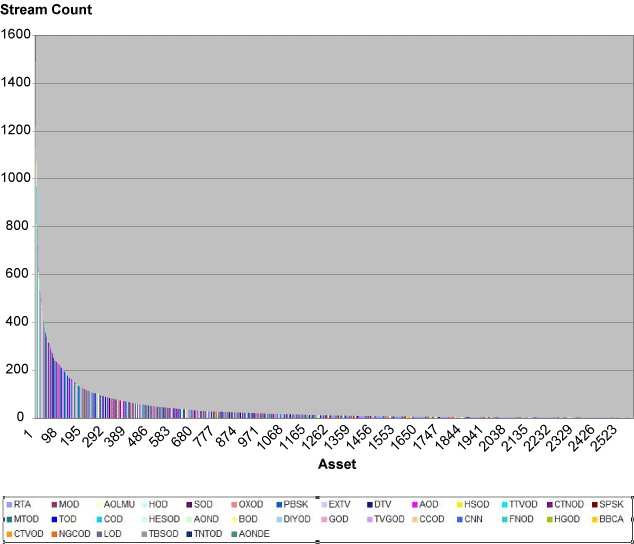
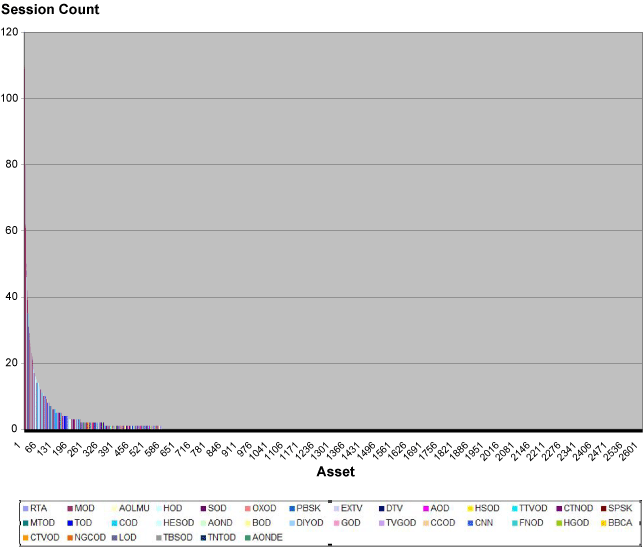 Analyzing the day view, the “long tail” is clearly observed. The number of assets played over a 24-hour period represents approximately 90 percent of the total content library. In this view, the top 190 assets account for 50 percent of the sessions, while the top 950 account for 90 percent of the sessions. RTA titles dominate the middle part of the curve. Likely, this shows that while RTA content is interesting, it is not on the server long enough to impact the day on an individual title basis over the course of an entire day. There are five music videos in the top 10, but it is actually a 30-minute television show on HBO that is No. 1. The peak views present a very different picture of the world, however. The purpose of the peak view is to analyze what is actually happening at a given point in time and what is actually distributed from the server. In this case, it is observed that 3,500 streams are supported with only 580 assets. On an aggregate basis, this amounts to a 6:1 stream to content ratio. The most popular content is an RTA asset (Start Over program), while MOD represents eight of the top 10 assets. The top 48 titles represent 50 percent of the streams, while the top 260 represent 90 percent of the streams. This phenomenon is not unique to Start Over systems; a larger, non-Start Over enabled system was found to have a stream to content ratio of 15:1. This is a fairly interesting set of observations. On one hand, over an extended period of time, it is clear that there is a content “long tail.” It is also evident that there is no content “long tail” at any single point in time. These two observations taken together seem to indicate that it will be important to consider the “long tail” in architectures associated with the distribution of content. Bottlenecks could occur in vault servers around peak contention and ingest points. However, with respect to streaming and server design, it is clear from the data that the challenge is serving up a relatively small number of assets to a large group of subscribers in a short time window. In other words, on-demand systems must be designed to handle the peak load at any given time. Modulation (dynamics in time) and genres Many previous content utilization analyses have provided the traditional “long tail” view of content utilization. This aggregate view has been presented many times and has become the “standard” view. But the contention of our research is that, while that aggregate view is not necessarily wrong, it does not tell the whole story of how people are interacting with content and the resulting dynamics within the VOD server complex. We need to consider the top-tier genres of content offered on the VOD platforms—HBO, MOD, Cinemax, music videos—and how they impact the VOD platform and the different characteristics of each of these elements. With MOD, a few assets are ingested off peak, most assets are around two hours, and they live for a month. HBO and Cinemax have similar ingest requirements, but have a mix of asset lengths. Music videos also are of particular interest because they exhibit a high demand, but their sessions are of a short duration, typically between three and five minutes. Thus, in an aggregate time view, the overall utilization of this category is very high, but in the “instantaneous” view, sessions start and end very frequently, creating very dynamic content velocities even within the same genre. With the addition of the Start Over service, we introduce the most transitory and “peaked” content of all the genres. This is because the Start Over content is derived from live broadcast programming, and its availability is closely tied to the broadcast schedule. Assets live during the broadcast window and then are deleted. Additionally, most assets are 30 minutes. The impact on the server is compounded by the fact that the content is ingested at the same time peak streaming is occurring. With each RTA provider, a unique ingest stream is required, creating the potential requirement for hundreds of simultaneous ingest streams while at peak streaming. When looking at a more granular view of the content utilization within a given day, each genre exhibits different peak utilization within the day. This can be seen by comparing the different utilization loads between the top four services within a Start Over division, namely, HBO, MOD, Start Over, and the music video genres. During a single day within the Start Over system, the delta among the three services can be seen to dramatically diverge during prime time as users migrate to that service. The most dramatic content velocity that can be easily seen is between MOD and Start Over. When directly comparing the two services, there are no less than 15 different lead changes in terms of which service exhibits the greatest simultaneous utilization within a given day. Additionally, when comparing Start Over and the most popular service—HBO—there is a single lead change between those two services. This leaves little doubt that with the introduction of Start Over, the impacts to the on-demand subsystem and content velocities are dramatic. Again, this set of data points out the differences between viewing content in aggregate vs. at a discrete point in time. Conclusions This article has attempted to apply real-world data to a number of longstanding theories by analyzing the successful introduction of the Start Over service. There are some very important conclusions to draw from the data. First, on demand usage characteristics vary wildly over time of day and day of the week. These characteristics are important for network planning and content management. Systems need to consider that—over extended periods of time—highly efficient propagation strategies, large libraries, and the “long tail” are important considerations. On the other hand, these systems show very different dynamics in discrete points in time. Content is in fact popular, and at any given point in time, there is no “long tail.” This implies that streaming subsystems aligned with peak usage on both Monday night and Saturday night must be built to handle peak usage at any point in time. Additionally, at a macro level, the content makeup of the system changes, but it changes in human time, not computer time. This means that over the course of one to two hours, there can be a large change in the makeup of the content on a system. However, this period is a very long time from the perspective of a modern solid-state system. In general, popular content within a genre remains popular throughout the day and the week. Less popular content tends to have a higher velocity of turnover. This points out potential scalability issues for large centralized vaults vs. distributed, peered content stores. As libraries grow and stream counts are driven higher, it will become even more important to dissect the difference between streaming and storage. In streaming subsystems, there is no long tail, and in content propagation systems, there is a very high velocity of content change as libraries grow. This will drive capacity and throughput requirements and tail length. To be effective, on-demand systems must be able to handle peak content usage at any point in time. Finally, although successful, Start Over is still in its infancy. The growth of the service will be seen in both the amount of new content and an increase in the number of streams. First, TWC hopes to partner with broadcasters for more content and to extend the Start Over window. Secondly, TWC plans to roll the service out to more divisions in 2006 and 2007. As more content is available and more subscribers have access, it will provide more interesting insights into cable’s future. Conrad Clemson is SVP, Technical Operations, Broadbus Technologies; Glen Hardin is Senior Director, Video Systems, TWC Advanced Technology Group. They can be reached at cclemson@broadbus.com and glen.hardin@twcable.com. This article was adapted from a paper presented at this year’s Cable-Tec Expo.