VoIP Testing
It looks like cable operators have struck oil with telephony service. Several MSOs are experiencing penetration rates of 20 percent and above. One independent operator has even noted that "all you need to do is crack open your window, announce you are offering telephony, and you have two weeks’ backlog of work." The oil analogy has more dimensions than revenue, however. Like crude oil, the information that defines a telephone call needs to be processed and transported to realize value. To keep the revenue flowing, cable operators need to test at three levels to ensure quality transport and a product that exceeds a century of consumer expectations. Figure 1 correlates three levels of testing and measurement to locations in a cable system. At the lowest level, signal carrier quality is observed via common analog measurements such as carrier-to-noise ratio (CNR), composite second order (CSO), composite third order—more commonly called composite triple beat (CTB)—and channel power. At the next level, constellations and quantitative measurements such as modulation error ratio (MER) and bit error rate (BER) provide an indication of the health of the signal. Finally, the quality of the call content itself—the voice conversation—is measured by its mean opinion score (MOS) or closely related derived parameters. Where testing starts depends upon the situation. For new service introduction, it makes sense to begin with basic carrier quality to build a firm foundation for the offering. On the other hand, the likely path when solving a customer’s complaint about voice quality for an offering that’s been marketed for some time would be to start with MOS measurements. 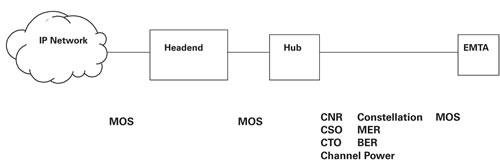 The pipe is physical Telephony quality begins with physical media. For cable systems, the medium is HFC plant that carries analog and digital information to network interfaces at hubs or headends. Although our telephony service is digital information, our transport mechanism is still analog. Impairments that adversely affect CNR and the presence of intermodulation distortion (CSO and CTB) have the same effect on digital information as a clogged pipeline does to petroleum transport. The damage done by changing data bit representations on an analog carrier is cumulative. Exceeding a packet loss threshold first garbles and then completely interrupts a voice conversation. While a maximum 3 percent packet loss was suggested as a guideline during early VoIP implementations, experience shows that it is best to shoot for between 0.1 and 0.5 percent for voice, and no more than 1 percent for high speed data. DOCSIS sets the guidelines in Table 1 for limits on physical impairments.
 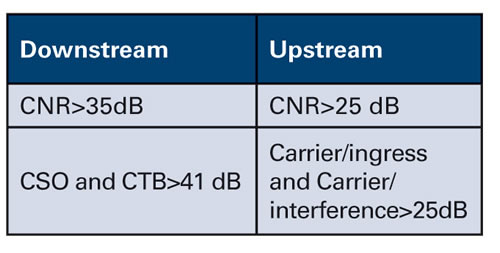 Channel power has a different effect. Because digital modulation spreads information across a frequency spectrum, for normal operating conditions, the sum of average channel power for all digital services plus analog channel peak power must not exceed laser power specifications. Note that ingress noise will add to the total. Traditionally, a spectrum analyzer is used to measure these parameters. However, because plant quality is so critical to digital signal transmission, most test instrument vendors have incorporated numerical readouts of these indicators into multifunctional hand-held devices easily deployed for field tests at all three levels. Examples include the JDSU Digital Service Activation Meter, Trilithic 860 DSPi, and Sunrise CM1000. Navigating by the stars Quadrature amplitude modulation (QAM) creates a constellation diagram. "Stars" in the diagram represent combinations of ones and zeros that are the coded equivalent of a snapshot sample of a voice conversation. Mathematicians have proven that perfect reproduction of a telephone conversation requires 8,000 unimpaired samples per second, so any faults that cause these stars to move or blur progressively degrade the quality of a call. The analog parameters discussed earlier can be one cause of such impairments. The codecs used to transform analog voice into the digital equivalent can be another. Visual inspection of a constellation can point to various network faults. For example, the constellation diagram in Figure 2 indicates phase problems.
  Because the precise amount of degradation is difficult to determine using pure visual analysis, mathematical sampling theory is applied to quantify the resulting errors. The two most widely used parameters for measuring modulation error are MER and BER. The two are mathematically related, allowing both to be available as readouts on test equipment. For digital signals, MER has been developed as a single indicator of system physical health, similar to baseband signal-to-noise ratio (SNR) in analog systems. MER can be defined in terms of two vectors, one pointing to an ideal constellation point, and the other pointing from an actual measured point to an ideal point, as shown in Figure 3. Statistical sampling and mapping constellations to mathematical coordinates create a numerical history of deviations from ideal star locations, allowing the derivation of a single number for MER that represents performance over time.
 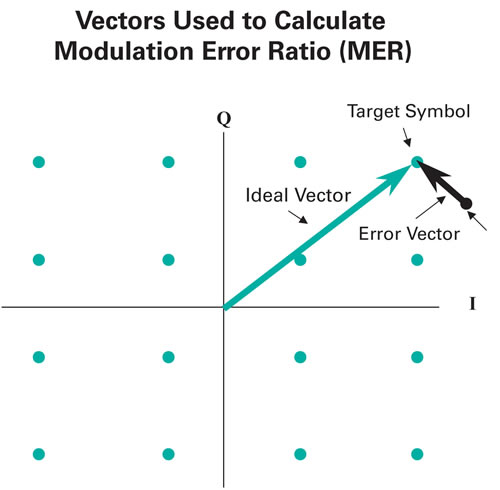 This numerical figure for MER is mathematically expressed as: MER (dB) = =20 log (average signal magnitude/average error magnitude) As a benchmark, downstream MER should be 27 dB or better for 64-QAM and 31 dB or better for 256-QAM. Upstream MER should be 12 dB or better for quadrature phase shift keying (QPSK) and 18 dB or better for 16-QAM. The ear is the boss Though carrier and bit integrity underly voice quality, in the end, subscriber perception is the determining factor. MOS is both the gold standard and grandfather of voice quality testing. Its methodology, which goes back to Bell Laboratories testing of network equipment, consists of assembling a panel of human listeners who rate the quality of several hundred speech samples from 1 to 5, with 5 indicating best quality. Perceptual speech quality measure (PSQM), perceptual analysis measurement system (PAMS), perceptual evaluation of voice quality (PESQ), and PESQ-LQ are variations of models that predict MOS scores based upon comparison of a voice file that has been processed by the network under test against a clean reference file. Tests using these models are called intrusive because they require a dedicated test call, rather than the use of actual conversations. The PESQ model provides scores from -0.5 to 4.5, with 4.5 indicating best quality, while PESQ-LQ scores range from 1 to 5, the same as MOS. PsyTechnics, one of the developers of PESQ, claims a correlation of better than 90 percent between PESQ and MOS. The ITU E Model is a design tool that predicts the average voice quality of calls processed by a network, based upon mathematical estimates of the effects of delay, jitter, packet loss and codec performance. It generates an R factor that rates a network from 0 to 100, with 100 indicating best quality. Because E model scores are based upon parameters that can be measured by test equipment, several vendors have correlated them to MOS scores to create MOS readouts. Similarly, ITU-T P.563 and PsyTechnics PsyVoIP are nonintrusive models that predict an MOS score based upon live traffic. These models analyze real-time protocol (RTP) streams for source and destination addresses, sequence number, and jitter profile and predict the impact of the Internet protocol (IP) bearer on the MOS value with an 80 to 90 percent correlation. Automated voice quality testing measures voice quality by averaging several call samples over time. The most valid application is between network aggregation points, such as gateway to gateway, with a large number of test calls to simulate behavior under actual network traffic volumes. Applied this way, a network quality number can be established as a metric for other tests. When individual test scores for network endpoints are observed, they can be compared against network averages to determine possible faults such as a malfunctioning codec in a multimedia terminal adapter (MTA), or trends, such as poor routes. Measuring voice quality The two common methods to obtain derived MOS scores in a cable network are to use information from either actual calls or test voice files generated by a server located in the network. As shown in Figure 4, both methods use software probes located at strategic measurement points in the network to collect statistics on packet loss and delay and make comparisons. Measurement devices can be either rack-mounted or hand-held units.
 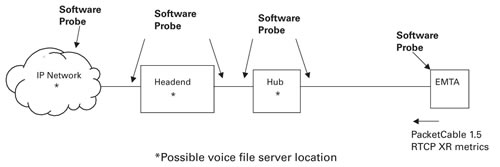 Prior to PacketCable 1.5, embedded MTAs (EMTAs) were not required to forward data to generate voice quality scores. Most live call data analysis occurs at network aggregation points via rack-mounted units. Poor MOS scores at aggregation points indicate a problem in the network, but further testing is required to narrow the problem to RF plant conditions, traffic blockage or packet degradation at the EMTA. In addition to analog testing and constellation analysis, intrusive troubleshooting can be done by comparing network test MOS scores to EMTA endpoint test scores observed at portable test equipment. In this case, a voice file server in the network under test generates test call files that travel as packets to measurement devices both in the network and at the EMTA. With current handheld test equipment, this type of MOS test can be done in both the upstream and downstream. After a downstream MOS is generated from a network-based voice file, test equipment at the customer premises sends its own test file, which generates the upstream counterpart. Both scores are provided as readouts at the field test gear. PacketCable 1.5 simplifies the troubleshooting process and allows it to be done without service interruption by specifying that endpoints such as EMTAs must exchange real-time transport protocol (RTP) control protocol extended reports (RTCP XR) voice over IP (VoIP) metric information for live calls. This requirement mandates that the EMTA transmit E model R factors and derived MOS scores, as well as underlying packet loss, packet discards related to delay, signal and noise levels, and residual echo loss. PacketCable 1.5 compliant EMTAs are expected to become more prevalent in the latter part of 2006. The bottom line When and where to test are determined by a combination of quality and economics. Extensive plant prequalification testing makes sense prior to initial telephony offerings and when a system is reconfigured. Without the automatic availability of the end point information specified by PacketCable 1.5, potential quality degradation that might result in lost customers must be balanced against the cost of dispatching a field technician to take quality readings. The availability of RTCP XR data and automated data collection at centralized network management locations makes continuous monitoring viable and should result in data that makes optimum voice quality possible. Justin J. Junkus is president of KnowledgeLink and telephony editor for Communications Technology. Reach him at jjunkus@knowledgelinkinc.com. Sidebar RTCP XR Explained Real-time transport protocol (RTP) control protocol extended reports (RTCP XR) is an Internet Engineering Task Force protocol defined in RFC 3611 that adds information to the RTCP packet streams being transmitted by PacketCable-compliant embedded multimedia terminal adapters (EMTAs). The extended report blocks contained in an XR packet provide a way to send information from Internet protocol (IP) endpoints that is useful for assessing voice quality and reasons for degradation. The seven block types defined by the specification contain information on received packet losses and duplicates, packet reception times, receiver reference time information, receiver inter-report delays, detailed reception statistics, and voice quality scores. Although the information is intended for exchanges between IP endpoints such as EMTAs and gateways, it may be accessed by software probes at intermediate points in a network, particularly at points where test equipment is assessing network health.