VoIP Availability – Part 2
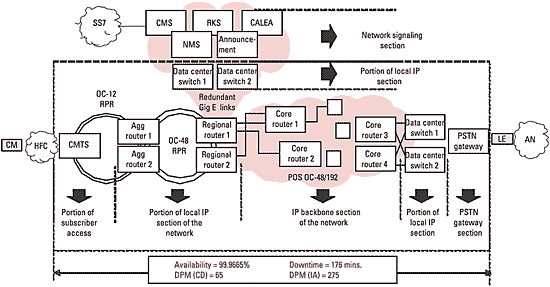
Before estimating network and service availability, it is useful to determine the downtime and service-availability budget. Figure 1 maps availability requirements, per the PacketCable report, to the network infrastructure from the cable modem termination system (CMTS) to the PSTN gateway.
For the portion of the network highlighted (from the CMTS to the PSTN gateway), the PacketCable-derived specifications are as follows:
- Availability greater than 99.9665 percent (or less than 176 minutes of downtime)
- Calls-dropped (CD) budget of less than 65 defects per million (DPM)
- Ineffective-attempts (IA) budget of less than 275 DPM
DPM(CD) and DPM(IA) budgets for each component are calculated using the ratio of the availability of that component to the total availability.
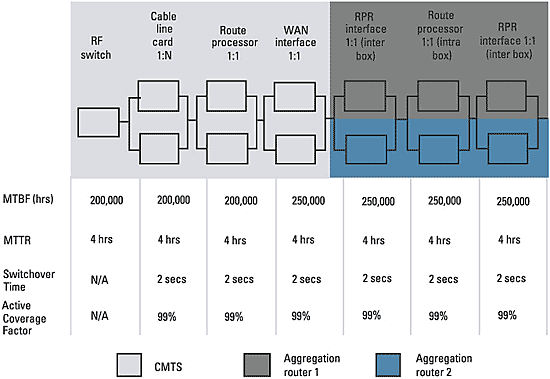
Estimating sample network availability Referring back to Figure 1, assume that the CMTS supports N:1 line card redundancy and has redundant route processors and redundant uplinks. The CMTS is then connected to a pair of redundant divisional aggregation routers in a resilient packet ring (RPR) network. This is then connected to a pair of redundant regional routers again in an RPR ring. This set of regional routers is connected to the OC-192 packet-over-SONET (POS) IP backbone consisting of 10 hops. The other side of the IP backbone is connected to a pair of redundant data center switches that provide connectivity to the PSTN gateway and also support N:1 line card redundancy and have redundant processors. Routing architecture and optimization In the sample network, open shortest path first (OSPF) protocol routing is used in the divisional and regional RPR rings, and border gateway protocol (BGP) routing is used in the core. Some failures in the network may take 5 to 6 seconds (or in some cases even longer) to recover, from a Layer 3 perspective. This is based on default timer values; for example, the default value of the OSPF computation timer is 5 seconds. However, this timer can be optimized to achieve convergence faster to meet the 3-second calls-dropped threshold. When there is a failure, and the adjacent device does not know about the topology change, traffic keeps being forwarded to the failed device until the Layer 3 timers determine the failure and reroute traffic. Here it may be necessary to reduce the OSPF “hello” and “dead” timers in addition to the SPF computation timer. The default values of hello and dead timers in OSPF are 10 seconds and 40 seconds respectively, and were set more than 10 years ago when data applications did not need fast convergence. As a result, without optimization it is possible for some failures to cause outages in the range of 40 to 45 seconds. However, reducing the dead timer to, say, 1.5 seconds and setting the hello timer to 0.5 seconds can help reduce the detection time to 1.5 seconds. Hence it is possible to see total outages of less than 3 seconds. In certain cases, depending on the complexity of routing in the network and the underlying network topology, static routing in certain parts of the network and reduced timers in others can lead to subsecond convergence. There is, however, a tradeoff in this case because if the timers are set too low, the result could be instability in the network. This can cause serious problems because a failure on one line card, which would otherwise affect service only to a set of customers, can now propagate to the rest of the network and affect a far greater number of subscribers. Cable operators must evaluate their specific routing architectures and determine the optimal convergence time to support voice. High-availability features The sample network contains certain high-availability features on the network elements. At the edges of the network (CMTS or PSTN gateway), if a line card fails, call state is transferred to the standby line card. Also, in other parts of the network, if a route processor fails, it does not reset the line cards, which continue forwarding traffic even when the redundant route processor is taking over. Reliability block diagram The first step toward computing network and service availability is to construct the reliability block diagram (Figure 2) for the overall network and estimate the mean time between failure (MTBF), mean time to repair (MTTR), switchover time, etc., for each step along the path of the voice call. Consider the CMTS and the aggregation routers as shown in Figure 2. Nonredundant components are modeled as serial elements, and redundant components are shown in parallel. Figure 2 is simplified for the purposes of illustration, but in reality, it is necessary to consider all the components—such as power supplies, timing and control cards, chassis and software—in a certain network device. MTBF, MTTR and failure scenarios This step combines the product-level availability information with the architectural dependencies and the operational impact. In other words, the combined effect of the three is taken into consideration here. For nonredundant components, such as the RF switch, the MTBF and MTTR are the same as shown previously. However, for redundant components such as the cable line card and others shown, it is necessary to calculate the “combined” MTBF and “combined” MTTR. This is done using the Markov State methodology outlined in part 1 of this article (December 2003, pg. 18). The idea is to reduce each redundant component into series equivalent nonredundant parts. To calculate the combined MTBF and the combined MTTR, first estimate the switchover time and active coverage factor. For example, in the case of the cable line card, the switchover time may be 2 seconds and the active coverage factor 99 percent (meaning that 99 percent of the time, the switchover will work). Estimating switchover time is a critical factor and needs to consider various system-level architectural dependencies. For example, consider the case of the WAN interface on the CMTS. If this component fails, the switchover time depends on how soon the upstream routers determine the failure, notify Layer 3, compute their routes again and start forwarding traffic to the redundant WAN interface. This depends on several factors such as detection time, SPF computation time, etc., on other devices and not only the CMTS. Thus, understanding this system-level interplay is critical in evaluating high availability. It is also important to calculate the upstream and downstream outage to determine the total outage for a voice call in the event of switchover. In the example network, as mentioned earlier, assumptions about routing optimization and systems-level lab test results determine that the outage will be less than 2 seconds. Like the preceding example, it is necessary to conduct systems-level lab tests to determine the switchover time for all the components in the end-to-end network and understand the total outage for a voice call in the event of a failure in any one of these components. In addition to the product-level availability information and the architectural dependencies for switchover time, it is also necessary to estimate the impact of the operational environment. In the event of the failure of a nonredundant component (or unsuccessful switchover of a redundant component), how long does it take to replace a part? This depends on how good the diagnostic tools are, the availability of tested spares and trained personnel and staffing levels (24-hour or business hours only). Assuming the failure is in a remote hub, with no tested spares, it may take up to 4 hours or more to detect and replace the failed component.
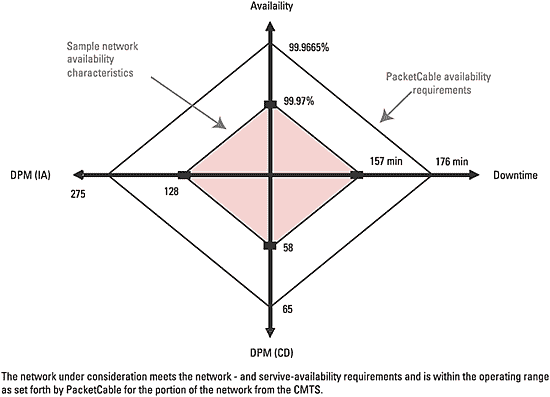
Combining all this information in the quantitative framework outlined in part 1 helps create an accurate picture of what network and service availability look like. Calculating network and service availability Once the combined MTBF and MTTR (taking into consideration the switchover time and coverage factors) of the series-equivalent components are determined, the network and service availability of the overall network is calculated as follows:  Results Figure 3 shows the results of the preceding calculation. The network under consideration is within the operating range set forth by PacketCable, and it meets the network- and service-availability requirements for the portion of the network from the CMTS to the PSTN gateway. Cable operators have to follow a similar methodology to analyze the cable modem and the DOCSIS plant to determine whether the end-to-end network can support a service that meets the PacketCable availability specifications. Operations play a critical role in a highly available network. Aspects of operations, such as the spare parts policy, regression testing, policies and procedures for upgrades, staging and monitoring significantly help to improve the service availability of a network. A finely tuned operational environment reduces the MTTR (in case of nonredundant components) and has a direct bearing on availability and DPM(IA). There is much more to availability than the percentage of uptime on a device. To design a highly available network, one has to consider end-to-end network availability and, more importantly, the service availability. In the case of voice, this includes calls dropped and ineffective attempts. When analyzing and designing a network for availability, there are complex system-level dependencies and interaction between devices to evaluate. Routing plays a critical role in highly available networks. For an IP network to offer the same availability as a PSTN, it does not need to have five-nines availability end to end; rather, it needs to have greater than 99.94 percent. It also must meet the end-to-end service-availability metrics of less than 125 DPM(CD) and less than 500 DPM(IA). It follows that all failures do not need to be recovered in less than 50 ms as long as the number of dropped calls and ineffective attempts do not exceed these requirements. The framework established here can be used to evaluate the availability and service availability of an IP network, study the effects of redundancy at different points in the network and determine if the network can meet service-availability specifications.
Lastly, it is possible for a well designed IP network to meet and in certain cases exceed the availability of the PSTN as shown in the example in this article. Navin Thadani is the manager for cable industry development at Cisco Systems. He may be reached at nthadani@cisco.com. The author would like to thank John Chapman, Jim Forster, Madhav Marathe, Henry Zhu and Jim Huang from Cisco Systems for their contribution to this article. Bottom Line How Available Is Your Net?
There is much more to availability than the percentage of uptime on a device. To design a highly available network, one has to consider end-to-end network availability and, more importantly, the service availability. In the case of voice, this includes calls dropped (CD) and ineffective attempts (IA). When analyzing and designing a network for availability, there are complex system-level dependencies and interaction between devices to evaluate. Routing plays a critical role in highly available networks. For an IP network to offer the same availability as a PSTN, it does not need to have five-nines availability end to end; rather, it needs to have greater than 99.94 percent. It also needs to meet the end-to-end service-availability metrics of less than 125 DPM(CD) and less than 500 DPM(IA). It follows that all failures do not need to be recovered in less than 50 ms as long as the number of dropped calls and ineffective attempts do not exceed these requirements. FIGURE 1: Mapping Availability Requirements to an End-to-End Network  FIGURE 2: Reliability Block Diagram
  FIGURE 3: Network- and Service-Availability Calculation Results