Linear Distortions, Part 2
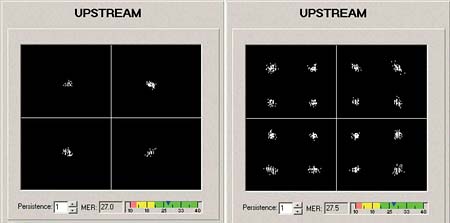
Part 1 of this two-part series introduced the "invisible" but disruptive nature of linear distortions and covered recognizing and troubleshooting micro-reflections and amplitude ripple and tilt. We now pick up at adaptive equalization. Adaptive equalization Another tool in the battle against linear distortions is adaptive equalization. Data Over Cable Service Interface Specification (DOCSIS) version 1.1 supports eight-tap adaptive equalization. DOCSIS 2.0 supports 24-tap adaptive equalization. Unfortunately, the large installed base of DOCSIS 1.0 modems won’t benefit from either because DOCSIS 1.1 and 2.0-specified adaptive equalization are done using pre-equalization in the modem. DOCSIS 1.0 modems generally don’t support adaptive equalization. When adaptive equalization is available, it may be able to compensate for some rather substantial linear distortions. The examples in Figure 1 illustrate a 6.4 MHz bandwidth 64-QAM (quadrature amplitude modulation) upstream digitally modulated signal at a center frequency of 48 MHz, well into the diplex filter roll-off area. This screen shot is from testing done in a lab setup. The tilt was caused by the modem’s internal low-pass filter, rather than amplifier or node diplex filters. The top screen shot shows the digitally modulated signal with no adaptive equalization. Single modem throughput was about 17 Mbps, but correctable forward error correction (FEC) errors were incrementing about 7,000 codewords per second (232 bytes per codeword). The cable modem termination system’s (CMTS’s) upstream signal-to-noise ratio (SNR) estimate—similar to modulation error ratio (MER)—was 23 dB. (Note: Some CMTSs can provide per modem upstream SNR estimates and FEC error information—additional useful tools for troubleshooting upstream impairments.) The bottom screen shot is the same signal with adaptive equalization turned on. The DOCSIS 2.0 modem’s 24-tap adaptive equalizer was able to pre-equalize the signal to overcome most of the amplitude tilt, resulting in a nearly flat signal at the CMTS input. There were no correctable FEC errors, and the CMTS’s upstream SNR estimate increased to 36+ dB. During the testing, the modem’s transmit level didn’t appear to be affected by adaptive equalizer operation. Group delay According to the IEEE Standard Dictionary of Electrical and Electronics Terms, group delay is "the derivative of radian phase with respect to radian frequency. It is equal to the phase delay for an ideal nondispersive delay device, but may differ greatly in actual devices where there is a ripple in the phase vs. frequency characteristic." What does this mean? Think about a North American cable system’s upstream spectrum. It starts at 5 MHz and stops around 42 MHz. That 37 MHz of RF bandwidth can be visualized as a bandpass filter of sorts, at least from the perspective of a signal traveling from a subscriber’s cable modem back to the headend. Whether one considers the reverse spectrum of a single amplifier or a cascade of amplifiers, a signal within that 37 MHz bandwidth will take a finite period of time to go from point A to point B because of the velocity of propagation through the amplifier(s), the cables and all the other parts that make up the transmission path. The velocity of propagation within a bandpass filter—in this case, the 5 MHz to 42 MHz reverse path—is not uniform across the spectrum. Velocity of propagation usually is a bit higher at the center of the passband than it is at the band edges. A signal takes a finite period of time to pass through a circuit, an amplifier or the entire cable network. This is known as propagation delay, transit delay or just plain delay. Signal delay also can be thought of as the slope of a phase vs. frequency curve. Absolute delay is the delay that occurs at some reference frequency. If the propagation time through that circuit, amplifier or system is not the same for all frequencies within a given bandwidth—say, the 5 MHz to 42 MHz reverse path—the result is the equivalent of phase shift. If the phase shift changes uniformly with frequency, there’s no problem. But if the phase shift does not change uniformly with frequency—that is, if the phase-frequency relationship is nonlinear—signals at the affected frequencies will be distorted. The result is called delay distortion or phase distortion. This is expressed in units of time, typically nanoseconds, relative to a reference frequency. Phase distortion often is measured by a parameter known as envelope delay distortion, which is the derivative of the phase shift with respect to frequency. Envelope delay distortion expresses the instantaneous slope of the phase shift characteristic and is the difference between the envelope delay at one frequency and the envelope delay at another frequency. Envelope delay distortion frequently is called group delay distortion. Another way to think of group delay is the rate of change in the slope of the phase vs. frequency curve. If a circuit, amplifier or system has zero group delay distortion, that means the phase-frequency characteristic is linear, and all frequencies within a certain bandwidth are transmitted through the circuit, amplifier or system in the same period of time. Specialized test equipment is necessary to see most linear distortions. In the example in Figure 2, a Holtzman Inc. Cable Scope, digital oscilloscope and personal computer (PC) combination displays four traces: impulse response (top trace); magnitude vs. frequency over the 5-42 MHz reverse path (second trace), which is what one might see on reverse sweep equipment; phase vs. frequency (third trace); and group delay vs. frequency (bottom trace). Note the bathtub shape in the group delay trace. The bathtub shape is common for filter group delay vs. frequency. In this example, the curve at the lower end of the spectrum (5 MHz to about 10 MHz) is group delay caused by amplifier AC power blocking filters, and the curve at the upper end (35 MHz to 42 MHz) is group delay caused by amplifier diplex filters. Group delay is reasonably flat—within approximately 100 ns—between 10 and 35 MHz. The best place to transmit high order modulation upstream signals in the example in Figure 2 is between about 10 MHz and 35 MHz, unless adaptive equalization is available. Even then, diplex filter-related group delay may be severe enough that not even adaptive equalization will do any good. Note, too, that group delay is cumulative, so modems transmitting 16-QAM from homes near a node may work fine, while those near amplifier cascade extremities will work intermittently or not at all. In both cases, quadrature phase shift keying (QPSK) may operate with no problems. The fix? Move the upstream digitally modulated signal to a center frequency below 35 MHz. In some instances, it may be necessary to operate below 33 MHz, especially if reverse amplifier cascades are lengthy. Linear distortions in the real world Figure 3 is another screen shot from a Holtzman Inc. Cable Scope. An echo at ~485 ns, visible in the top trace, causes both amplitude ripple (second trace) and group delay ripple (bottom trace). Note that even with group delay ripple present across the 5-42 MHz spectrum, the group delay trace retains the classic "bathtub" shape. This particular problem was caused by a defective tap faceplate. The ports had been twisted, damaging the internal connections. One can use the formula D = 492 x VP/F to calculate the approximate distance to an impedance mismatch. D is the distance in feet to the fault from the test point; VP is the cable’s velocity of propagation (typically ~0.87 for hardline cable); and F is the frequency delta in MHz between successive standing wave peaks on the sweep trace. The amplitude ripple peaks in Figure 3 are approximately 2.08 MHz apart, so the distance from the test point to the impedance mismatch is just over 200 feet: D = 492 x VP/F D = 492 x 0.87/2.08 D = 492 x 0.42 D = 206.64 feet The cable industry has a good understanding of nonlinear distortions such as composite triple beat (CTB), composite second order (CSO), common path distortion (CPD) and cross-modulation (XMOD). These are easily measured with spectrum analyzers and similar test equipment. Linear distortions—while certainly not new in cable networks—are not as widely understood. They can’t be seen on most conventional test equipment, and with the possible exception of chrominance-luminance delay inequality (a form of group delay) in analog TV channels, the measurement of linear distortions is something that most of us have little experience with. Figure 4 shows another example of linear distortions in an operating cable network. In this case, a micro-reflection caused a -33 dBc echo at just over 1 µs. This echo is enough to create a slight amount of amplitude and group delay ripple. The test equipment used to display this screen shot is Sunrise Telecom’s AT2500RQ analyzer, in conjunction with a USG-equipped CM1000. The CM1000 was taken to the field and a 3.2 MHz bandwidth upstream test signal transmitted back to the headend. The AT2500RQ was tuned to the test signal frequency and displayed what is shown in Figure 4. A clean upstream: Or is it? Sunrise Telecom’s CM1000 with USG module and AT2500RQ spectrum analyzer were used to characterize the apparently clean upstream in Figure 1 in part 1 of this article last month. In the top trace in Figure 5,the test equipment’s adaptive equalizer graph shows a ~2.5 µs micro-reflection at about -23 dBc. The micro-reflection caused 1.6 dB peak-to-valley in-channel amplitude ripple (second trace) with the ripples spaced 400 kHz apart, and ~270 ns peak-to-peak in-channel group delay ripple (bottom trace). Note that the group delay ripple is off-scale in the third trace. The micro-reflection, amplitude and group delay ripple shown in Figure 5 cannot be seen on a conventional spectrum analyzer or signal level meter (SLM). Indeed, if one looked at just the spectrum analyzer screen shot in Figure 1 in last month’s article, it would be easy to assume the upstream should have no problem supporting 16-QAM. Yet 16-QAM would not work! (Note: The MER value shown in Figure 5, 31.5 dB, is an equalized value.) The 400 kHz-spaced amplitude ripple suggests an impedance mismatch about 1,070 feet from the test point. In order to see the 400 kHz-spaced ripples on a conventional reverse sweep, it would be necessary to have sweep points at least every 200 kHz. The MER failure threshold for 16-QAM is in the 17 dB to 20 dB range (10 dB to 13 dB for QPSK). Ideally, one should have at least 6 dB of headroom above the crash point for reliable operation. The MER in Figure 6 is too close to the failure threshold for reliable operation. The MER value shown in the figure, 21.3 dB, is the equivalent of an unequalized value. This explains why 16-QAM would not work on this upstream. A clean upstream The test equipment screen shots shown in Figures 7-9 illustrate a relatively unimpaired upstream from a linear distortion perspective. The spectrum analyzer display in Figure 7 shows the usual ingress in the 5~20 MHz range, the upstream data signal, and the test signal. Figure 8 shows no high-level micro-reflections (top trace), no significant amplitude ripple (middle trace), and a small amount of group delay (bottom trace). The constellation display in Figure 9 is clean, with an unequalized-equivalent MER of 28.3 dB. This is well above the failure threshold for 16-QAM. During this particular test, the cable modem frequency and test signal frequency were swapped, and the performance remained nearly identical to what is shown in these three figures. Figure 10 includes two screen shots of clean upstream QPSK and 16-QAM constellations and MER. These are from a Filtronic Sigtek ST-261 DOCSIS protocol analyzer. This particular instrument can show unequalized upstream constellation and MER performance of a single modem based on its media access control (MAC) address, or all modems on a given upstream channel. When linear distortions or other impairments affect upstream data transmission, the ST-261 can show what’s happening to the MER and constellation. Summary When QPSK works fine in the upstream but 16-QAM does not, or 64-QAM works fine in the downstream but 256-QAM does not, the culprit may well be linear distortions. An otherwise clean spectrum can be affected by micro-reflections, amplitude and group delay ripple—so-called invisible impairments—even when ingress, impulse noise, the carrier-to-noise ratio (CNR) and signal levels are perfect. Linear distortions are real problems in cable networks. Linear distortions can seriously affect downstream and upstream data transmission. Their impact is becoming more apparent as cable operators switch to higher orders of modulation. Conventional spectrum analyzers, SLMs, and ingress monitoring systems are not enough when it comes to linear distortions because they generally cannot be seen on this type of test equipment. Among the tools available to troubleshoot linear distortions include forward and reverse sweep, set to the maximum available resolution. Reverse sweep is better because of its finer resolution than the typical 6 MHz sweep points used in the downstream. Another effective tool is adaptive equalization, but this benefits only DOCSIS 1.1 and 2.0 modems. Most DOCSIS 1.0 modems do not support adaptive equalization. Some current-generation CMTSs can provide per modem upstream SNR estimates (similar to MER) and FEC error information—both of which are additional useful tools for troubleshooting upstream impairments. Avoiding frequencies above about 35 MHz is helpful for minimizing diplex filter-related group delay in the 5-42 MHz upstream. In most cases, though, specialized test equipment is necessary to identify and troubleshoot linear distortions. Several test equipment manufacturers now have available suitable products that can be used for this purpose. As mentioned in the introduction to Part 1 of this article last month, an understanding of linear distortions is critical to achieving the reliability necessary for new services being deployed on today’s cable networks. Video, data and voice are all converging in broadband network designs. To ensure smooth transitions in this convergence, cable operators must develop and implement test methodologies that account for linear distortions in their networks. Ron Hranac is a technical leader, Broadband Network Engineering, for Cisco Systems and senior technology editor for Communications Technology. Reach him at rhranac@aol.com. Figure 1 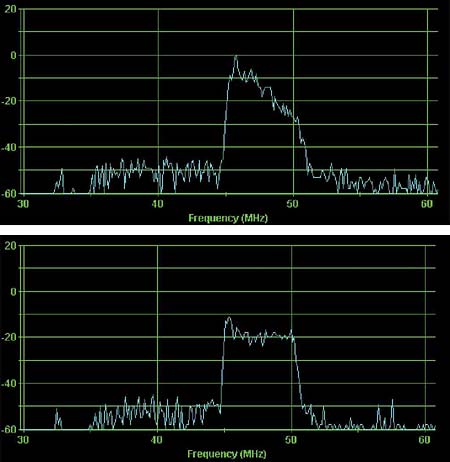 Figure 2
 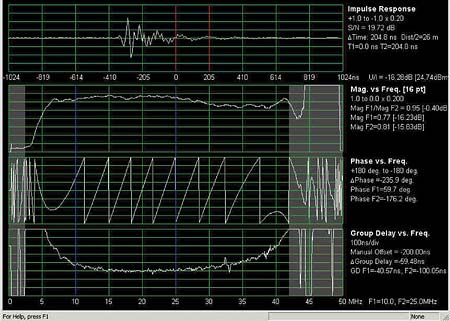 Figure 3
 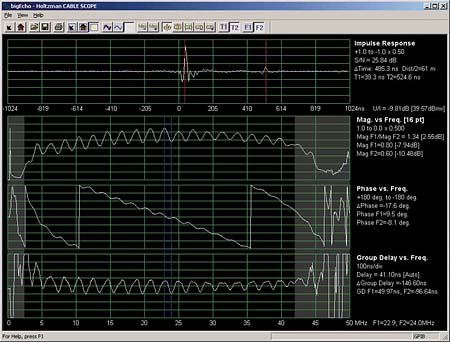 Figure 4
 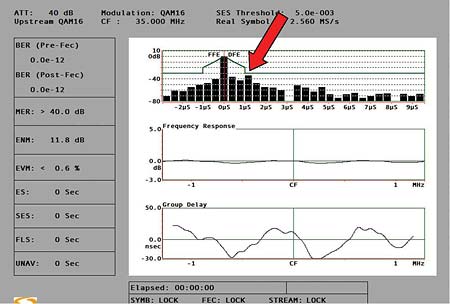 Figure 5
 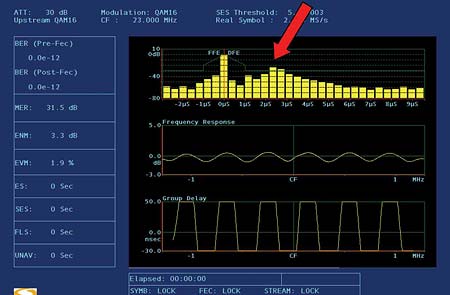 Figure 6
 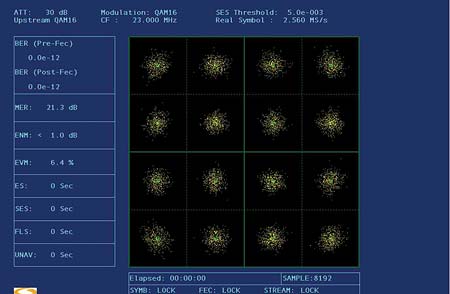 Figure 7
 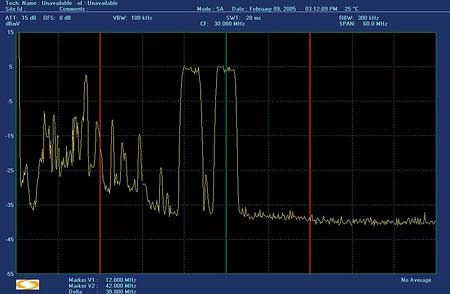 Figure 8
 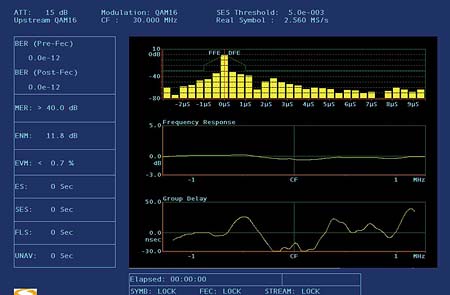 Figure 9
 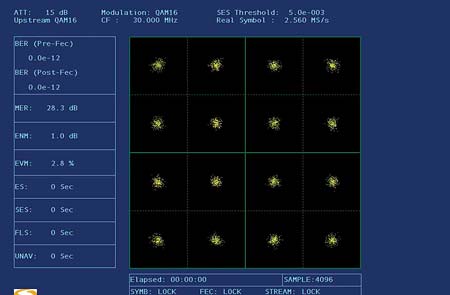 Figure 10